
The default file name of the Employee Ledger report is OR EMPLOYEE LEDGER_<MMDDYYYY_hhmmss>.pdf.
The report is 132 columns wide and 66 lines long. Each employee record begins on a new page.
The following image shows the report file layout.
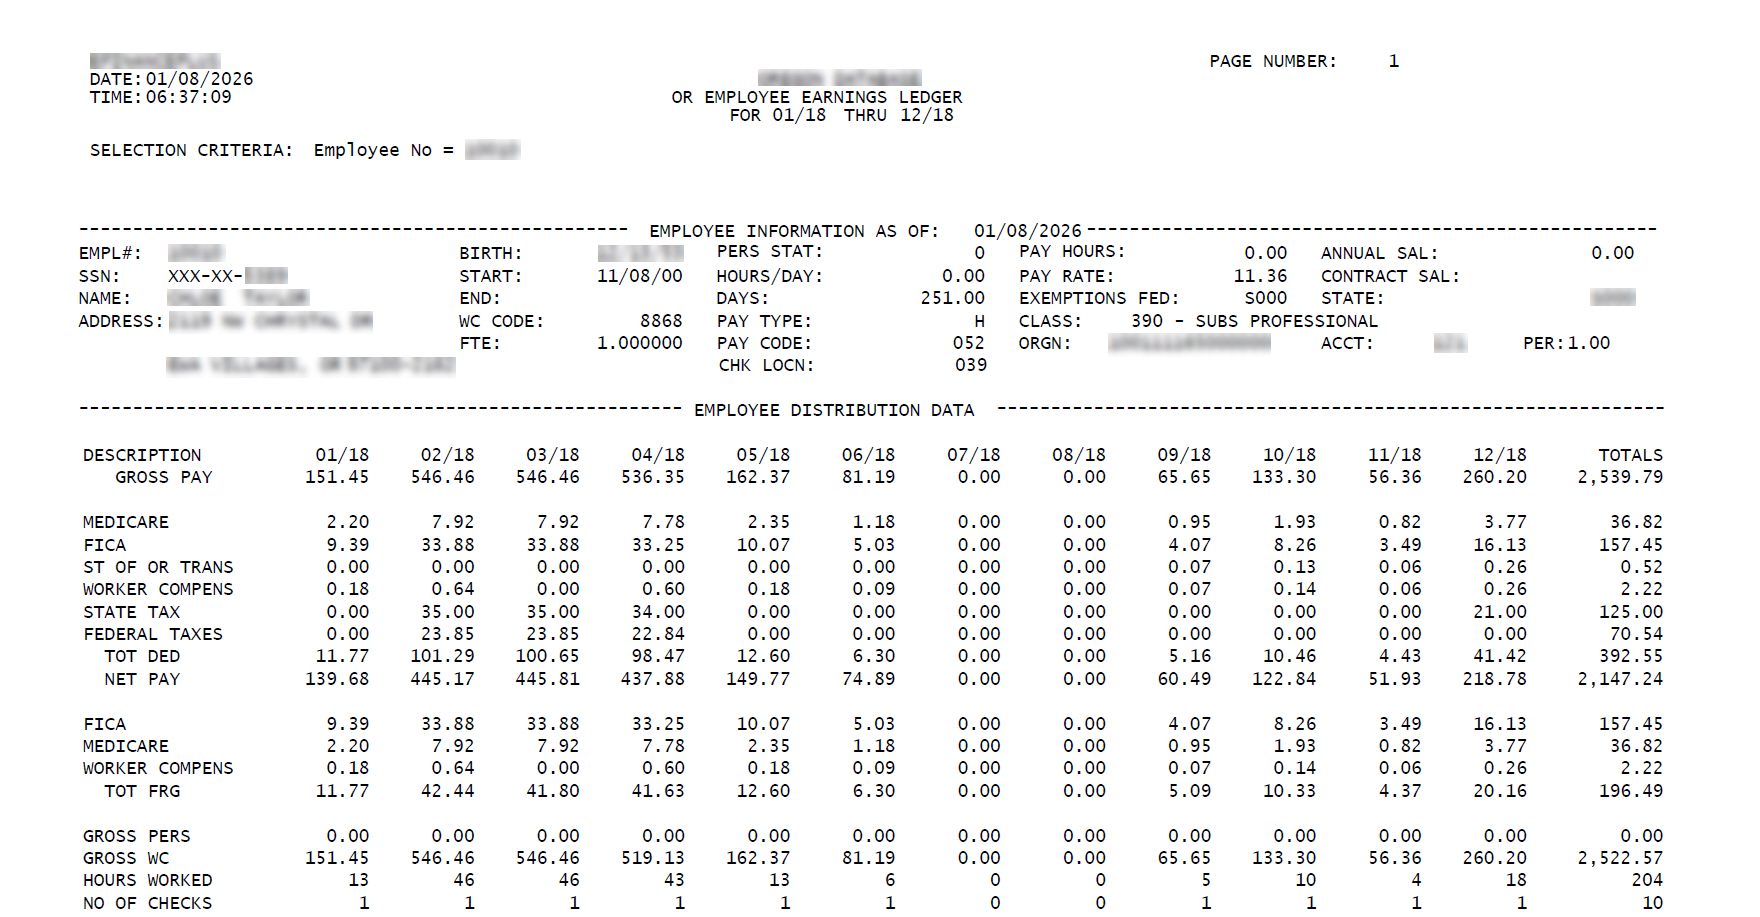
The report file consists of the following sections: